
This has been a really nice spring. The cold winter weather didn’t just slam into hot summer. We had a lot of sunshine in April; only about a quarter of the days were overcast. In contrast, last year about half of the April days were totally overcast and it rained….a lot. During April and May last year, we got almost 6 inches aver the average. This year April and May have had below average rainfall until last week when we had a 2 inch rain event and the water level in the Creek and oxbow came up 2 feet.
Before that rain event, water levels in the oxbow had been lower than in all of 2018 and 2019 because both of those years had record-setting rain. The resulting high water table and general saturated conditions maintained sustained bank-full flows through most of both years. And, those high water levels caused lots of erosion and deposition that produced lots of changes in the Creek channel.
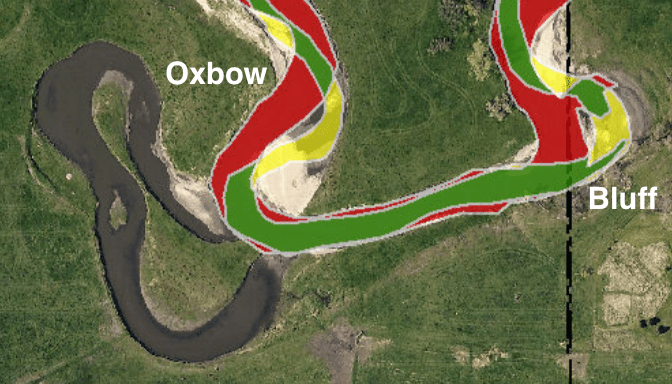
The channel shifted laterally because of erosion (red) on the steep banks and deposition (yellow) on enlarged sandbars. This map (from the post on April 1) shows changes in the main channel between 2017 and 2019. In the next couple of weeks, we’ll look at changes near the “Bluff” upstream from the oxbow. But, the changes within the oxbow were much less dramatic. Most oxbow changes were vertical build-ups by deposition, especially where the more stable oxbow channel joins the dynamic flows in the main channel.
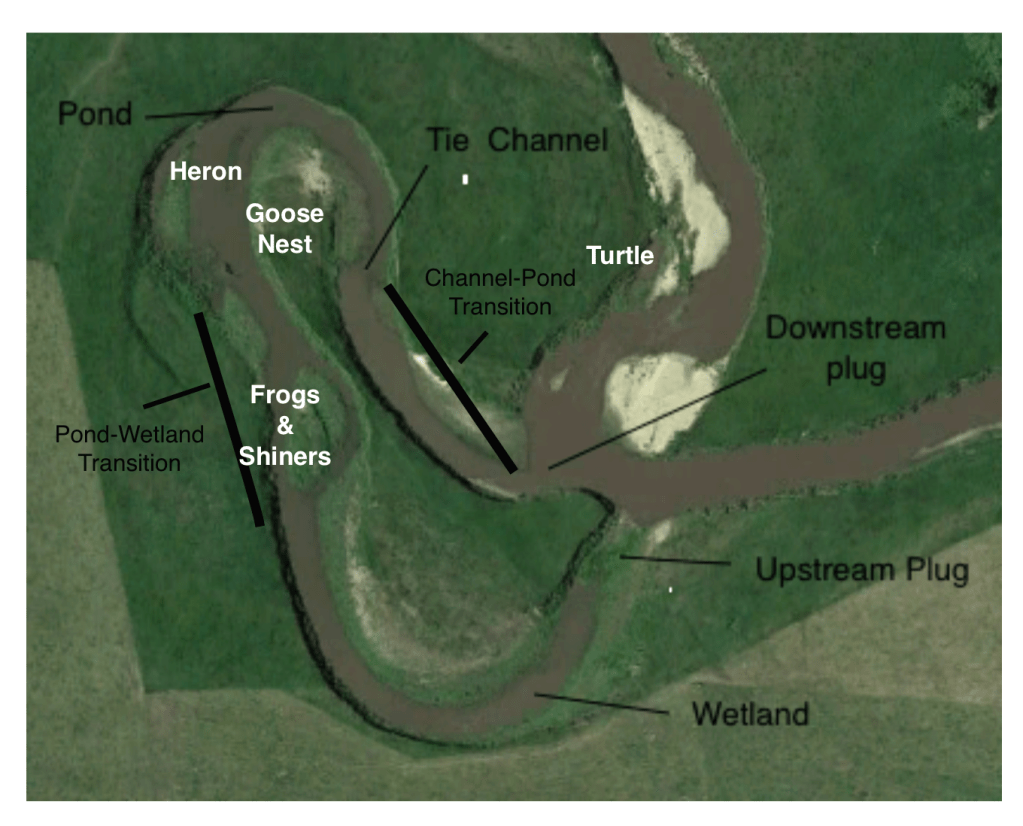
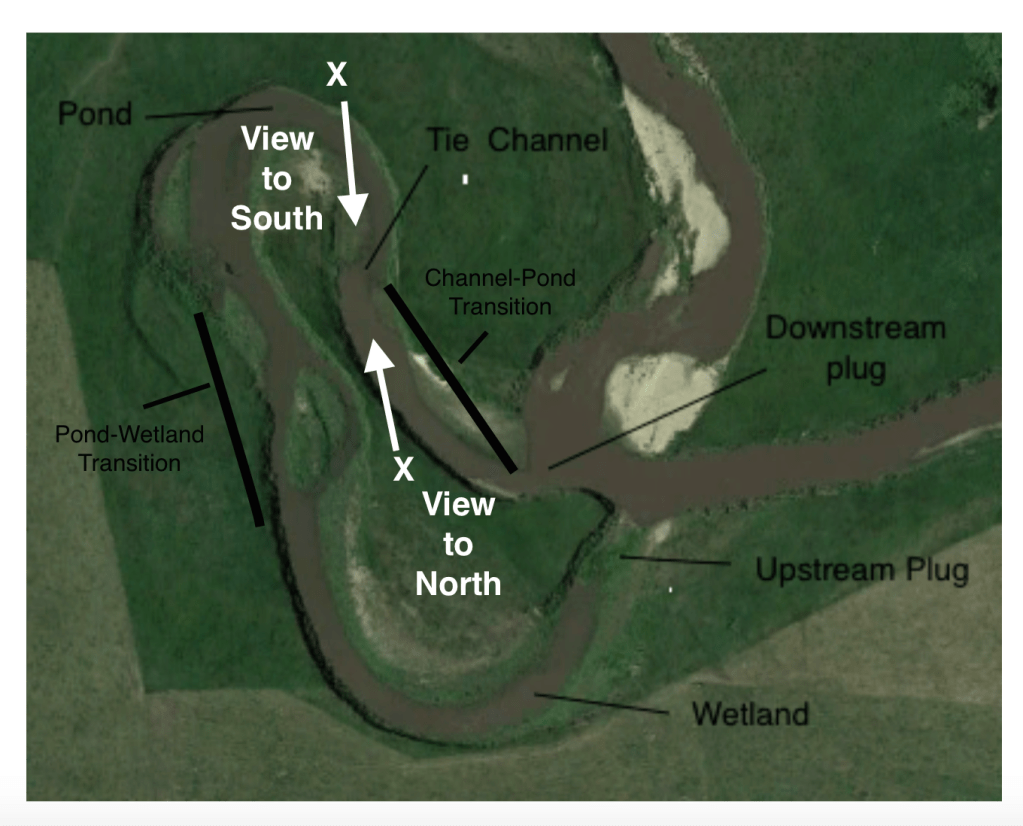
In 2014 the oxbow formed when a meander in the stream channel cut through to isolate the pond and wetland from the main flow. This first picture shows the location of the animals described in last week’s post. It also has the parts of the oxbow labeled as they appeared in 2015. The upstream plug and downstream plug are areas of depositional build up that separate water in the pond and wetland from the water in the channel, unless there is a high water level. Then the plugs are over-topped and water flows into the oxbow. The second picture shows the location of the two views shown below.
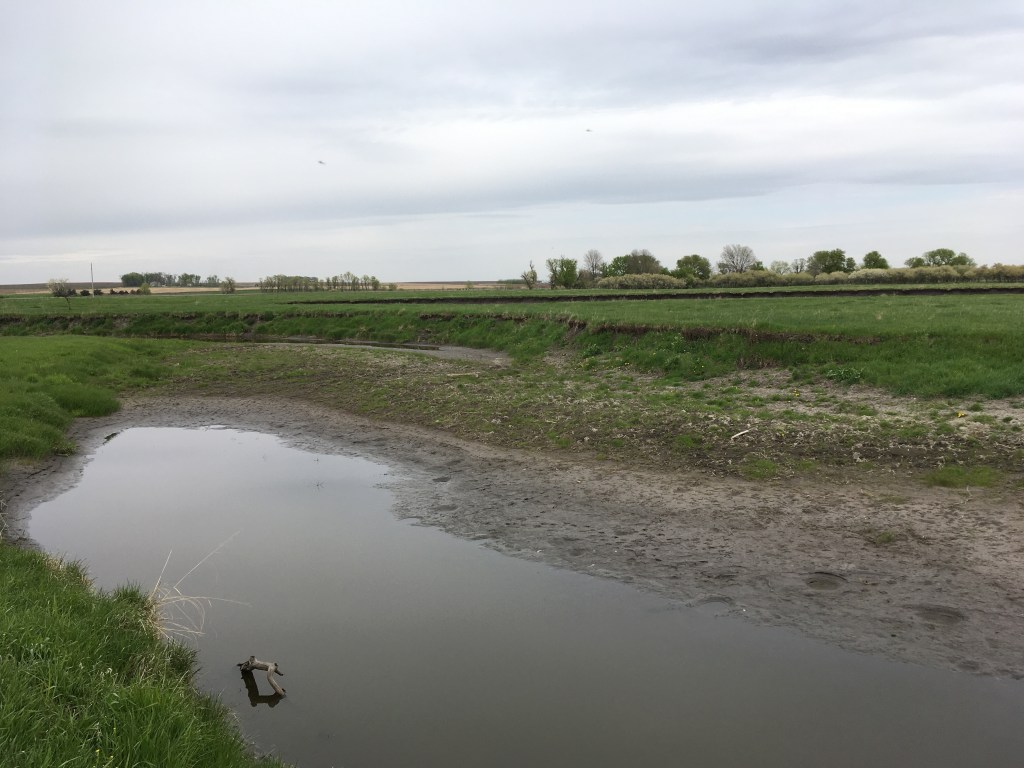
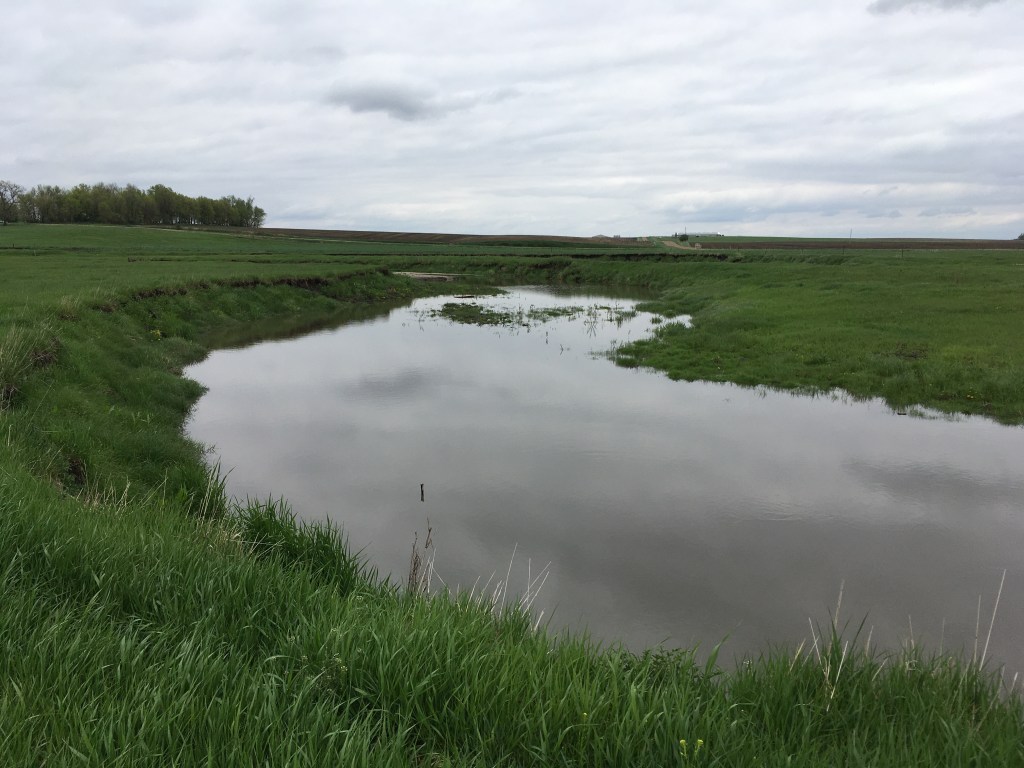
On May 12 before the recent rain event, the photo on the left shows the view toward the north of the tie channel as it appeared at low water level. The lightly vegetated high area through the central field of view was built during the high water levels of 2018 and 2019. After the recent rain event, the photo on the right is the view of the tie channel toward the south. This second picture was taken on May 18 at the time of a high water level similar to last year. The central vegetated area has been completely inundated and now the water in all parts of the oxbow is connected to the main flow in the channel. Raising the water level by 2 feet makes a big difference in both the biological habitats and in the environments of erosion and deposition.
This is a brief explanation about information sources. Weather and water level measurements were made here on Lone Tree Farm for databases maintained by the state of Minnesota. The map of cut and fill areas was produced in the Rock County Land Management Office. The oxbow components are based on a technical paper by Rowland and others (2005).

Pingback: Oxbow Evolution | Lone Tree Farm on Kanaranzi Creek
Pingback: Surveying the Creek Channel | Lone Tree Farm on Kanaranzi Creek